Read your stress test result
The result counts how many market paths your plan worked in. Worked means your spending never fell below your success floor, and your savings lasted. Each year, the success floor is what your Must have expenses cost. In a year with none, it is 75% of that year's planned spending.
Updated November 21, 2026
- Step 1:
Under Results, Summary shows how many paths worked, such as 94 of 100. Also run Past markets runs the same plan on the past periods in the order they happened.
Sample plan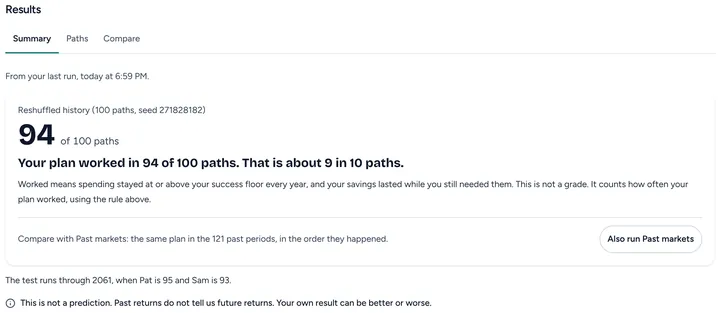
- Step 2:
With Plus, Key numbers show the savings at the end on a middle path, the years when paths came up short, and the lowest spending year.
Sample plan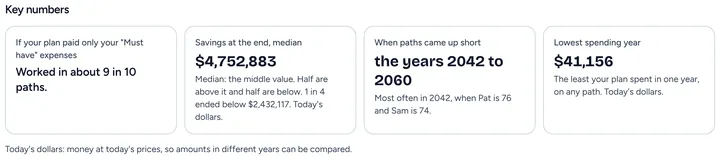
- Step 3:
With Plus, the savings chart shows the range of paths as bands. Turn on Show each path to draw every path, or press View as table.
Sample plan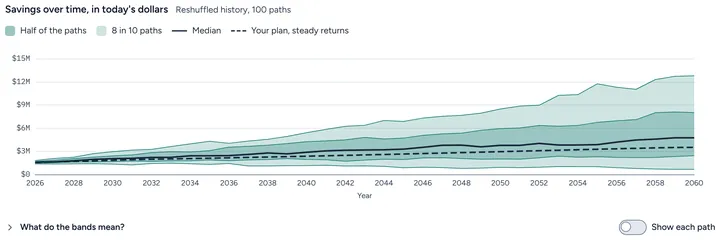
- Step 4:
With Plus, the paths below the chart are grouped by how they ended: spent as planned, came up short in the last 10 years, or came up short before. Use the button on a card to list that group.
Sample plan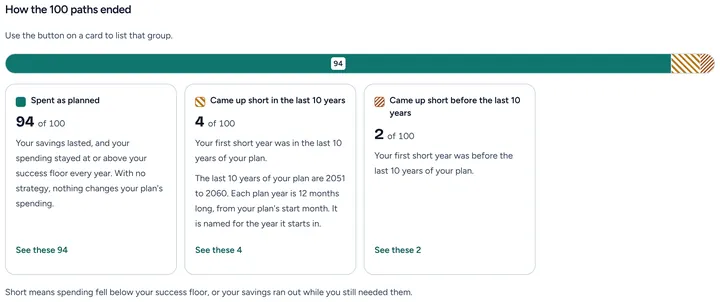
Good to know
- Results are estimates, not promises. A count is not a grade and not a prediction.
- Past returns do not tell us future returns. Your own result can be better or worse.
- Free shows the one result for your plan. Plus shows each path the test ran.
- Read more: Sequence of returns
Still stuck? Email support@filoah.com.